Repurposing data to make roads safer
safety
Developing spatially integrated datasets that leverage administrative, social media, private, and more traditional sources can help to pave the way for smart and socially beneficial investments and policies.
Reducing road mortality by half (Sustainable Development Goal 3.6) could save 675,000 lives a year. Yet the countrywide investments in regulation, enforcement, education, and infrastructure needed to attain this ambitious target are often out of reach. Resource constraints require countries to make smart choices on where and how to invest. Knowing where and when road traffic crashes happen can help to prioritize investments where they matter most. Unfortunately, many countries facing these difficult choices have little or no data on road traffic crashes and inadequate capacity to analyze the data they do have. Official data on road traffic crashes capture only 56 percent of fatalities in low- and middle-income countries, on average.1
Crash reports exist, yet they are buried in piles of paper or collected by private operators instead of being converted into useful data or disseminated to the people who need the information to make policy decisions. In Kenya, where official figures underreport the number of fatalities by a factor of 4.5,2 the rapid expansion of mobile phones and social media provides an opportunity to leverage commuter reports on traffic conditions as a potential source of data on road traffic crashes.
Big data mining, combined with digitization of official paper records, has demonstrated how disparate data can be leveraged to inform urban spatial analysis, planning, and management.3 Researchers worked in close collaboration with the National Police Service to digitize more than 10,000 situation reports spanning from 2013 to 2020 from the 14 police stations in Nairobi to create the first digital and geolocated administrative dataset of individual crashes in the city. They combined administrative data with data crowdsourced using a software application for mobile devices and short message service (SMS) traffic platform, Ma3Route, which has more than 1.1 million subscribers in Kenya. They analyzed 870,000 transport-related tweets submitted between 2012 and 2020 to identify and geolocate 36,428 crash reports by developing and improving natural language processing and geoparsing algorithms.4
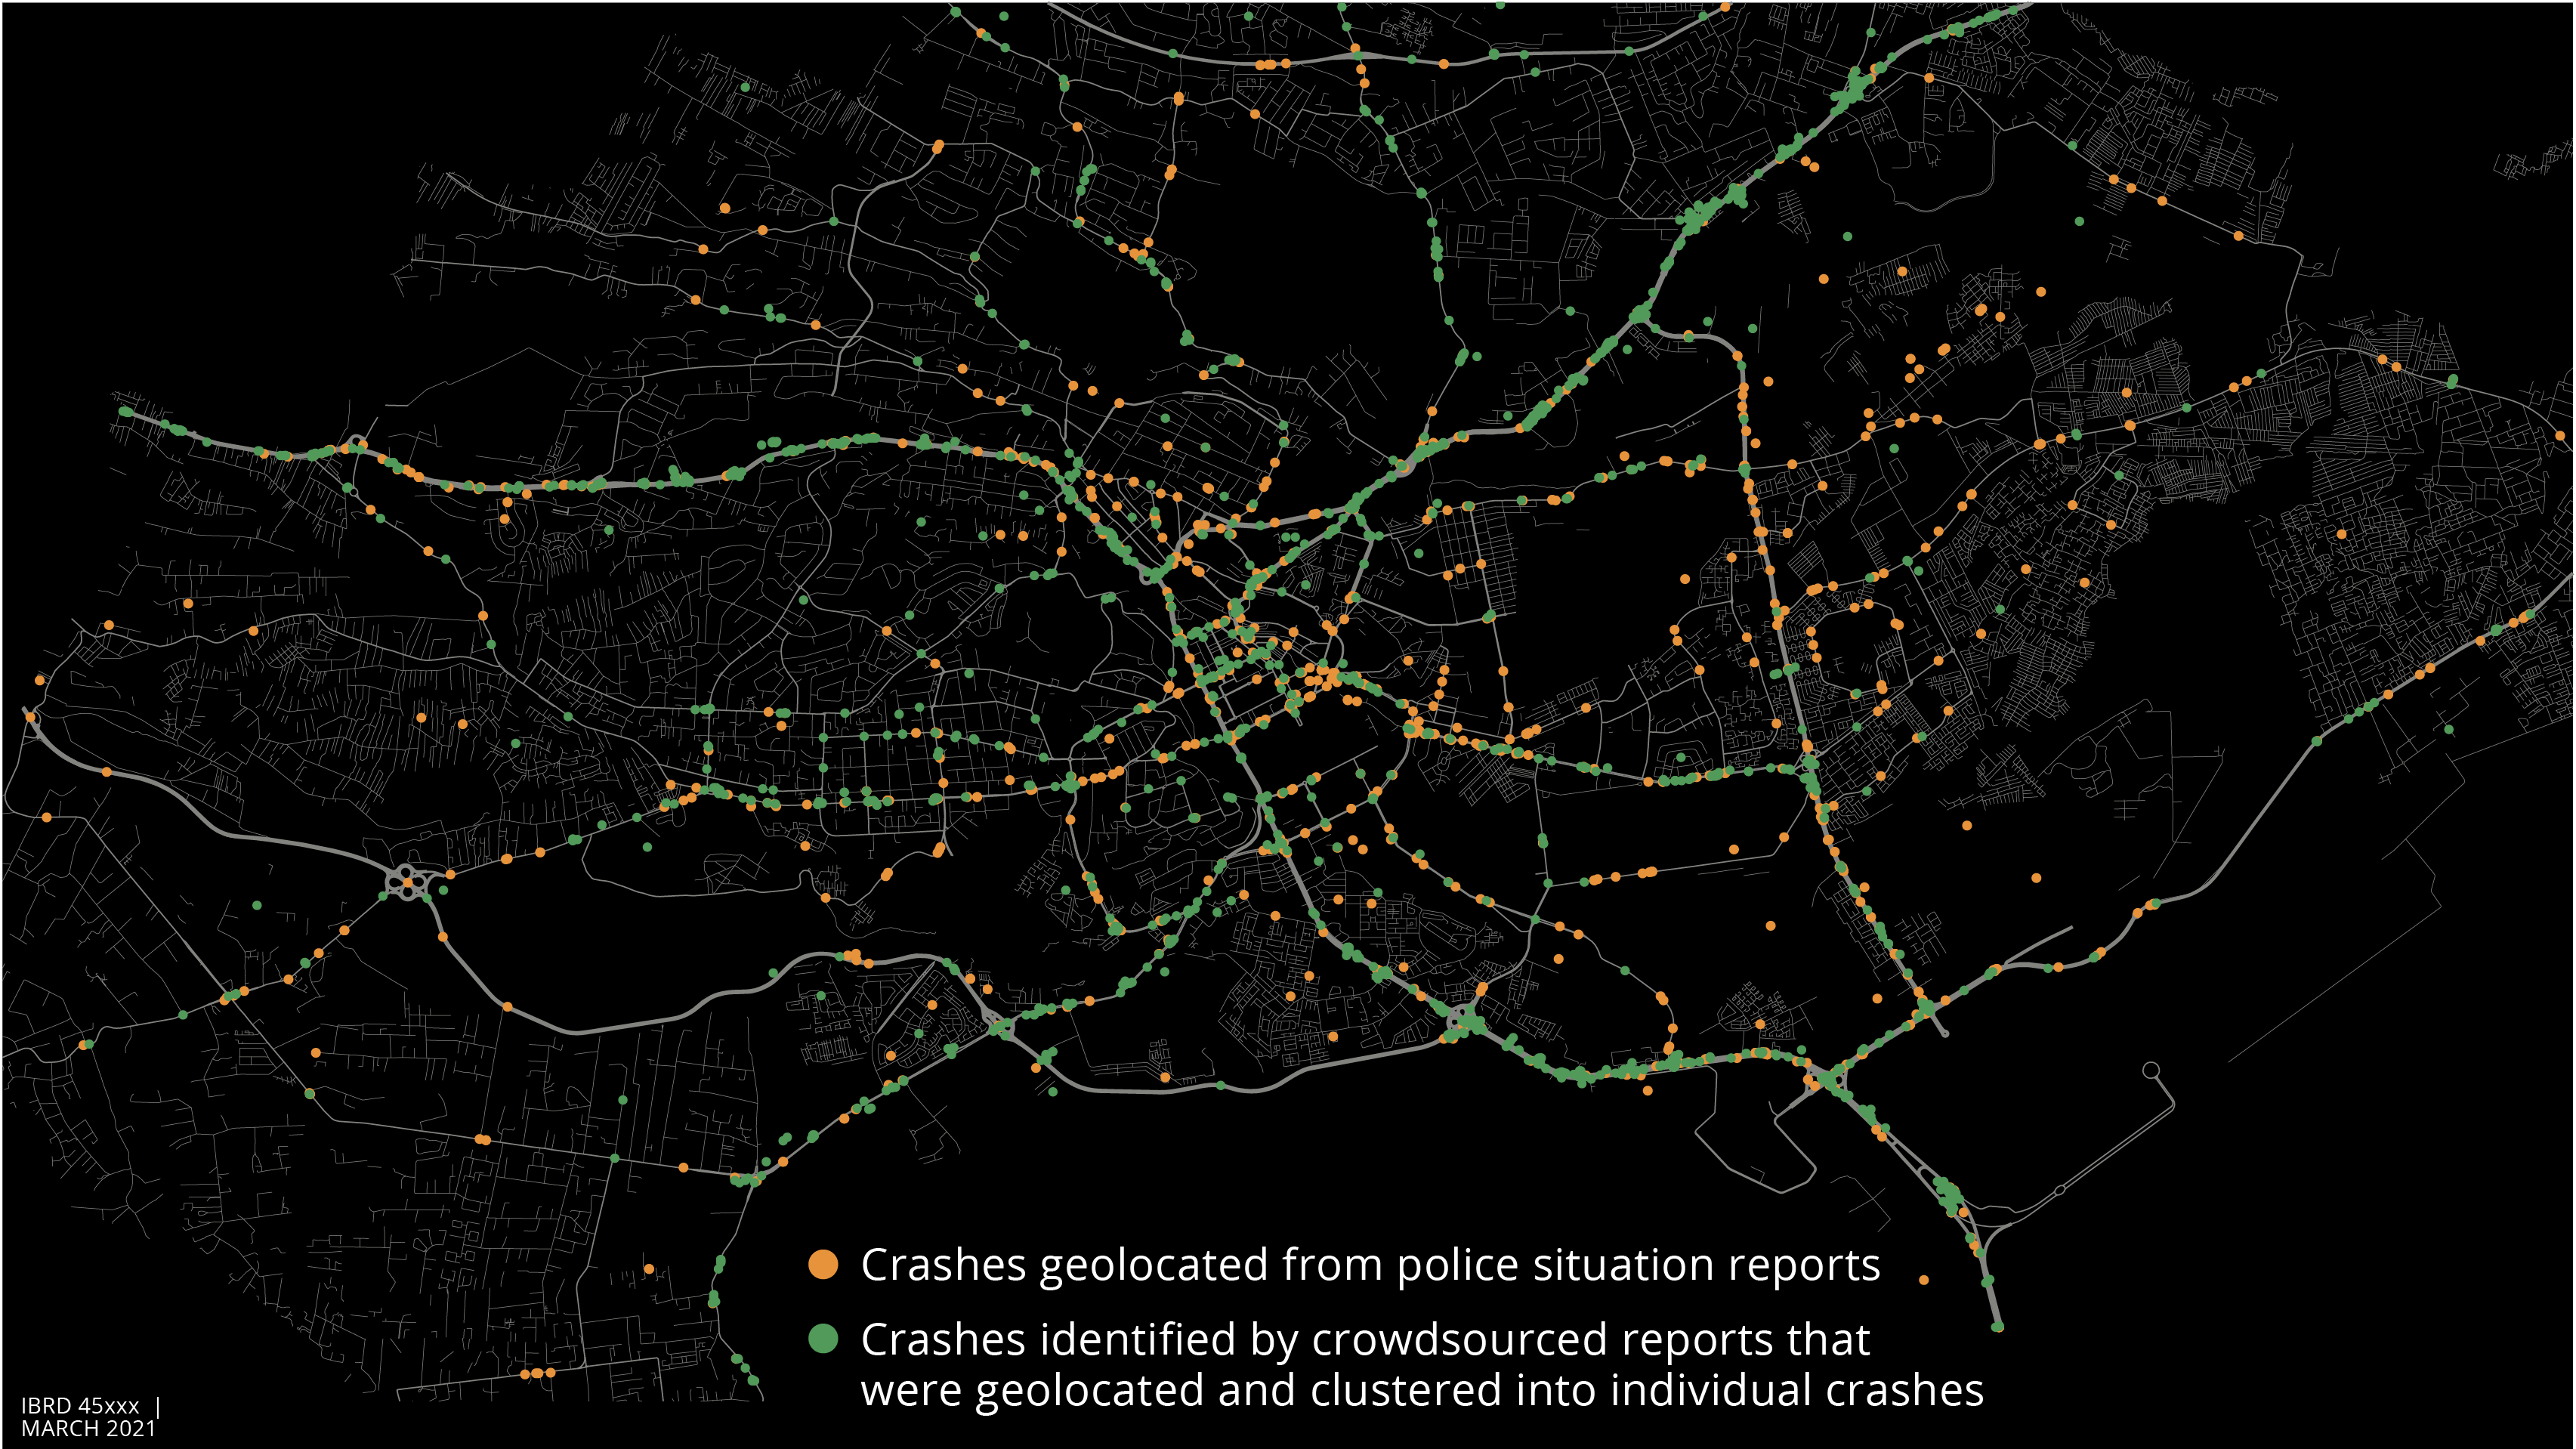
Source: Milusheva et al. 2020.
Note: Data shown are for July 2017–July 2018.
To verify the accuracy of crowdsourced reports and the efficiency of the algorithms, the team dispatched a motorcycle delivery company to the site of the reported crash minutes after each new crash report was received for a subset of reports. In 92 percent of cases, a crash was verified to have occurred in the stated location or nearby. By combining these sources of data, researchers were able to identify the 5 percent of roads (crash black spots) where 50 percent of the road traffic deaths occur in the city (map S4.2.1).
This exercise demonstrates that addressing data scarcity can transform an intractable problem into a more manageable one. In this case, investing in the safety of a 6,200-kilometer road network is intractable. Digitizing and analyzing administrative data and variables on injuries and deaths can help to narrow down the locations and times of the day and week that are associated with the most severe crashes. The analysis offers an invaluable road map for future regulation, infrastructure, and enforcement efforts.
More insights can be gained by integrating existing data and collecting further information, such as Uber and Waze data on average speeds on road segments and on road obstacles; Google Maps data on land use; and weather data on driving conditions. The researchers also invested in a massive data collection effort that is surveying the infrastructure and videotaping and coding the behavior of road users in 200 crash black spots in the city. The analysis of these new data will generate hypotheses to optimize the policy response to the road safety problem.
Overall, developing spatially integrated datasets that leverage administrative, social media, private, and more traditional sources can help to fill data gaps and pave the way for smart and socially beneficial investments and policies.
- WDR 2021 and World Health Organization (WHO) team calculations based on a comparison of reported deaths from the WHO Global Status Report on Road Safety (WHO 2018).
- WHO (2018).
- Milusheva et al. (2020).
- The new algorithms build on work by Finkel, Grenager, and Manning (2005); Gelernter and Balaji (2013); and Ritter et al. (2011).
- Finkel, Jenny Rose, Trond Grenager, and Christopher Manning. 2005. “Incorporating Non-local Information into Information Extraction Systems by Gibbs Sampling.” In 43rd Annual Meeting of the Association for Computational Linguistics: Proceedings of the Conference, edited by Kevin Knight, Hwee Tou Ng, and Kemal Oflazer, 363–70. New Brunswick, NJ: Association for Computational Linguistics.
- Gelernter, Judith, and Shilpa Balaji. 2013. “An Algorithm for Local Geoparsing of Microtext.” GeoInformatica 17 (4): 635–67.
- Milusheva, Sveta, Robert Marty, Guadalupe Bedoya, Elizabeth Resor, Sarah Williams, and Arianna Legovini. 2020. “Can Crowdsourcing Create the Missing Crash Data?” In COMPASS ’20: Proceedings of the 3rd ACM SIGCAS Conference on Computing and Sustainable Societies, 305–06. New York: Association for Computing Machinery.
- Ritter, Alan, Sam Clark, Mausam, and Oren Willi Etzioni. 2011. “Named Entity Recognition in Tweets: An Experimental Study.” In Conference on Empirical Methods in Natural Language Processing: Proceedings of the Conference, 1524–34. Stroudsburg, PA: Association for Computational Linguistics.
- WHO (World Health Organization). 2018. Global Status Report on Road Safety 2018. Geneva: WHO.