Community-led data collection in rural India
india
A novel experiment in India empowered villagers—particularly women, many of them illiterate—to design their own process for collecting and deploying data
In 2014 the World Bank’s Social Observatory, working closely with the Pudhu Vaazhvu Project of the South Asia Livelihoods team in the south Indian state of Tamil Nadu, developed a method called participatory tracking.1 This effort built on the institutional context in India, whereby democratically elected village councils hold regular, open village meetings in which budget priorities are planned and monitored, and there is a network of women’s self-help groups with a strong presence in every village in the state. Participatory tracking proceeded in three steps.
First, representatives of women’s groups from 200 villages engaged in several weeks of deliberations to think about what constitutes the good life for them, turn those ideas into indicators measured using survey questions, and then test those questions in their villages through a simple questionnaire that took no more than 30 minutes to answer.
Second, the community-designed questionnaire was incorporated into tablet-based software. A member of each women’s group was trained via video on how to administer the questionnaire in her own village. In the pilot, women were able to conduct a census of 40,000 households in about six weeks. Once the survey was conducted, the data were dispatched directly to a cloud server to prevent anyone from tampering with them.
About one-third of villagers could not read or write. Thus, the team developed ways of showing the data that would be understandable to people who were not literate.
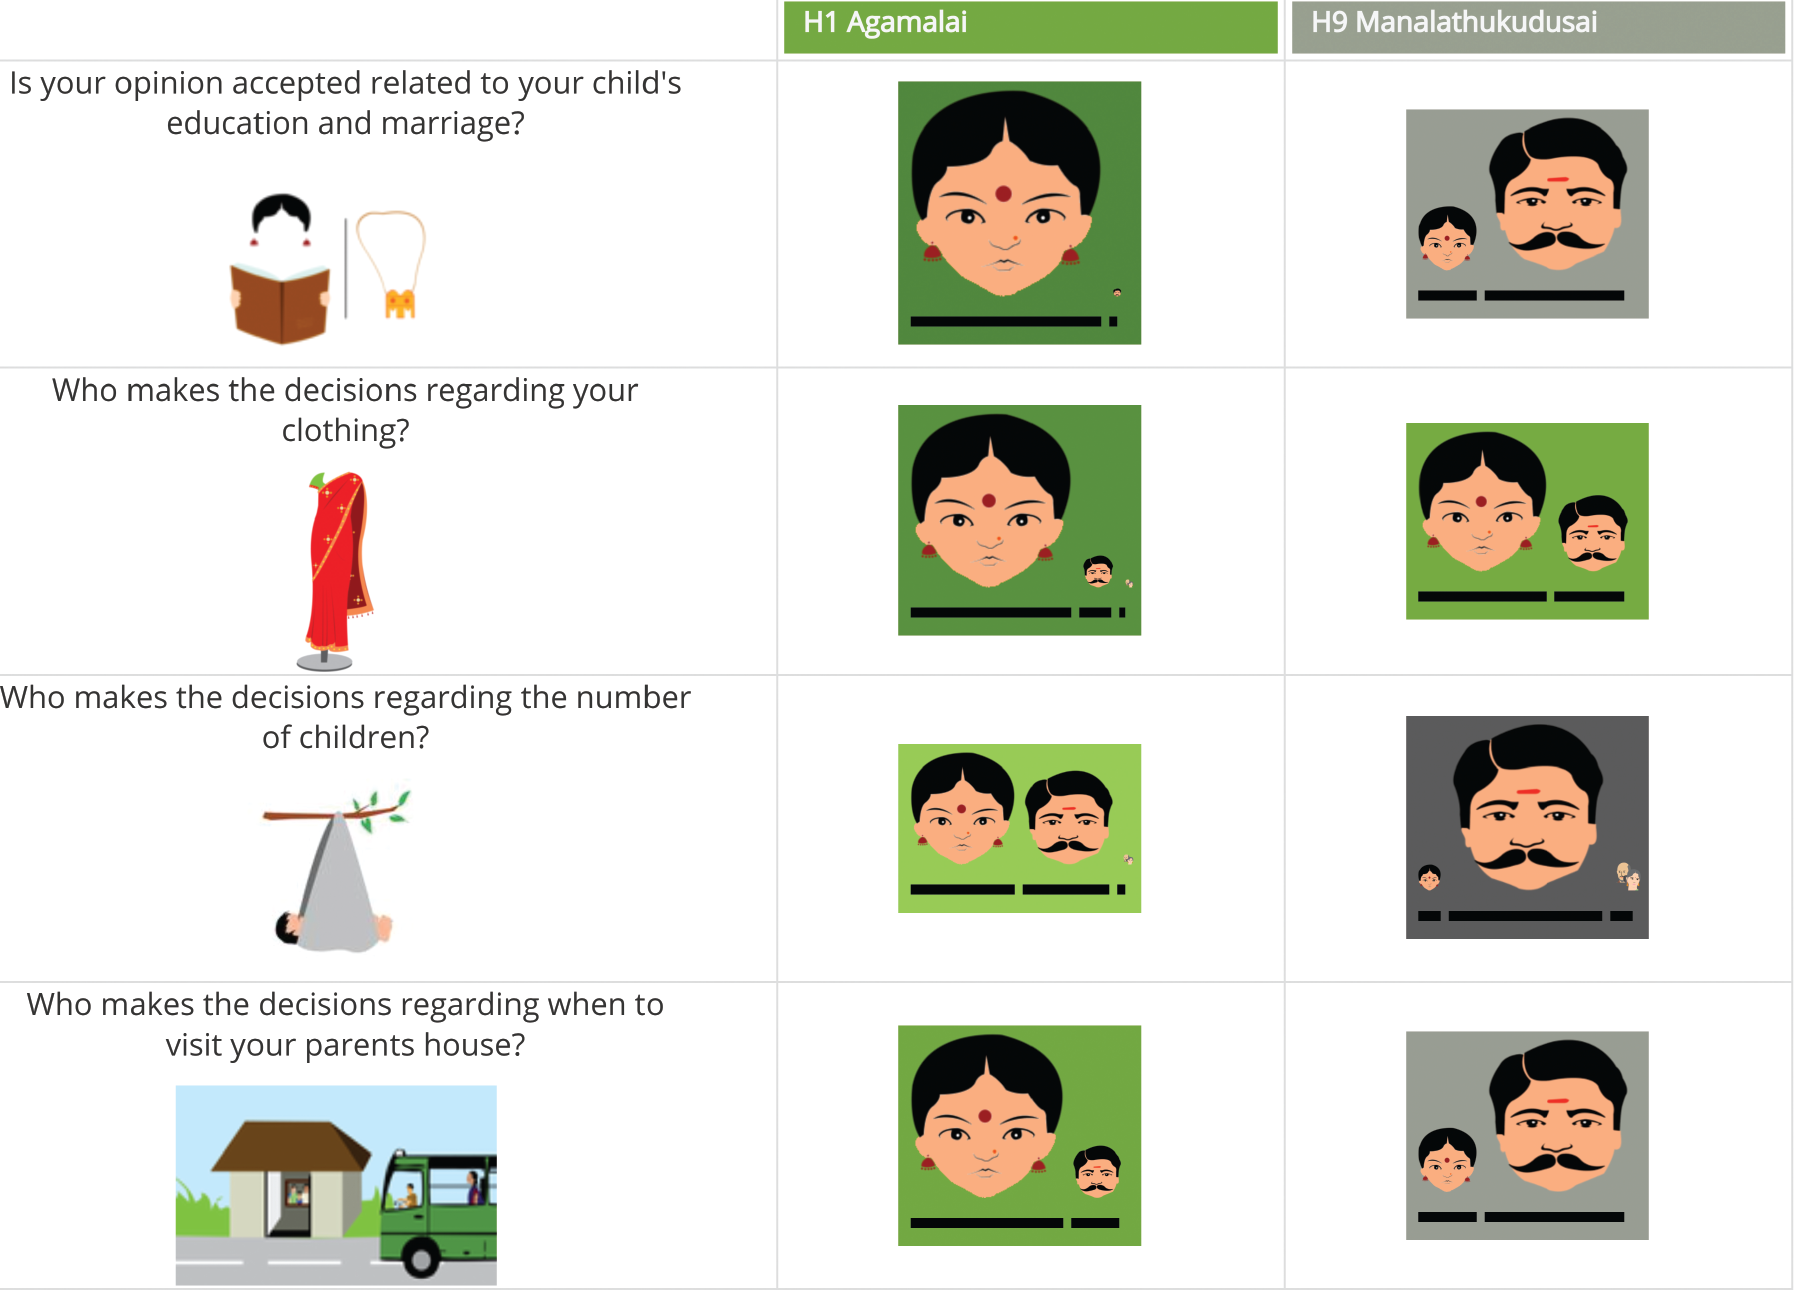
Third, the Social Observatory team “coproduced” data visualizations with the community. Figure S1.1.1 provides an example, developed to demonstrate variations in decision-making within the household. If a member of the family has more authority over a decision, his or her face becomes bigger. If women have more authority, the colored background shades from dark gray toward dark green. The village median is displayed alongside that of another vil-lage for comparison. These data were presented at village planning meetings. They substantially improved the quality of deliberation by allowing citizens and officials to focus on the issues of concern rather than debate the facts about where decision-making power lay.
Versions of participatory tracking that focus more on the management of public goods and common property are being designed and will be scaled up in the Indian states of Tamil Nadu (where the pilot was developed) and Karnataka, which will cover more than 75 million people, and nationwide in Indonesia, which will cover another 145 million.
Source: Palaniswamy, Sakhamuri, and Xia 2017.
Note: The figure shows a screenshot of a data visualization developed to demonstrate variations in household decision-making. If a member of the family has more authority over a decision, his or her face becomes bigger. If women have more authority, the colored background shades from dark gray toward dark green.
- Palaniswamy, Sakhamuri, and Xia (2017).
- Palaniswamy, Nethra, Smriti Sakhamuri, and Cassandra Xia. 2017. “Participatory Tracking: Customizing Visualizations.” Social Observatory (blog), September 2017.